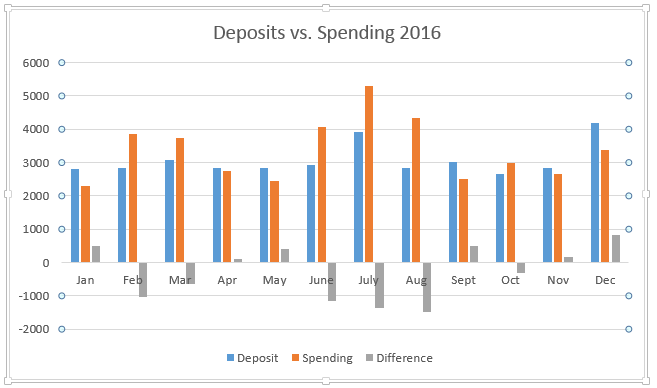
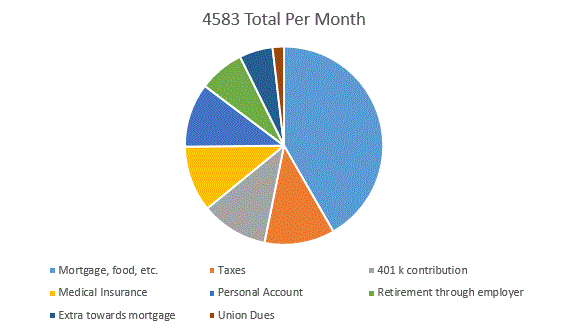
My hubby and I are spending more than we’re earning. Not good, or at least not sustainable. So I thought I’d see what Quicken says about where the money is going.
I looked at what we’ve spent January through September of this year, and figured out this is what we are spending each month:
| Home (mortgage, repair, decorating) | 905 |
| Food (groceries and eating out) | 759 |
| Bills (water, electricity, natural gas, phones, etc.) | 414 |
| Health (appointments, therapy, gym membership) | 377 |
| Cars (repairs and gas) | 234 |
| Pets (food, vet, training) | 186 |
| Entertainment (going to movies, Netflix) | 91 |
| Travel (vacation) | 81 |
| Personal Care (haircuts, clothes, shoes) | 65 |
| Taxes (what we owed for federal income tax;divided by 9 months) | 51 |
| Shopping (miscellaneous) | 48 |
| School Loan (paid my significant other’s bill by mistake) | 34 |
| Other | 36 |
Both DH and I want to feel free to spend what we want. We don’t consider ourselves big spenders overall, so our next step is to figure out what we want to curb, so we can feel good about our spending.
Peace Out (and In),
Jaye
Leave a Comment
Pingback: I Love Money Charts! – Peace Out (and In) on October 4, 2016


0 COMMENTS